Portfolio
Updated: 04/01/2025
📊Data Science and Analytics
Google Fiber Data Analysis
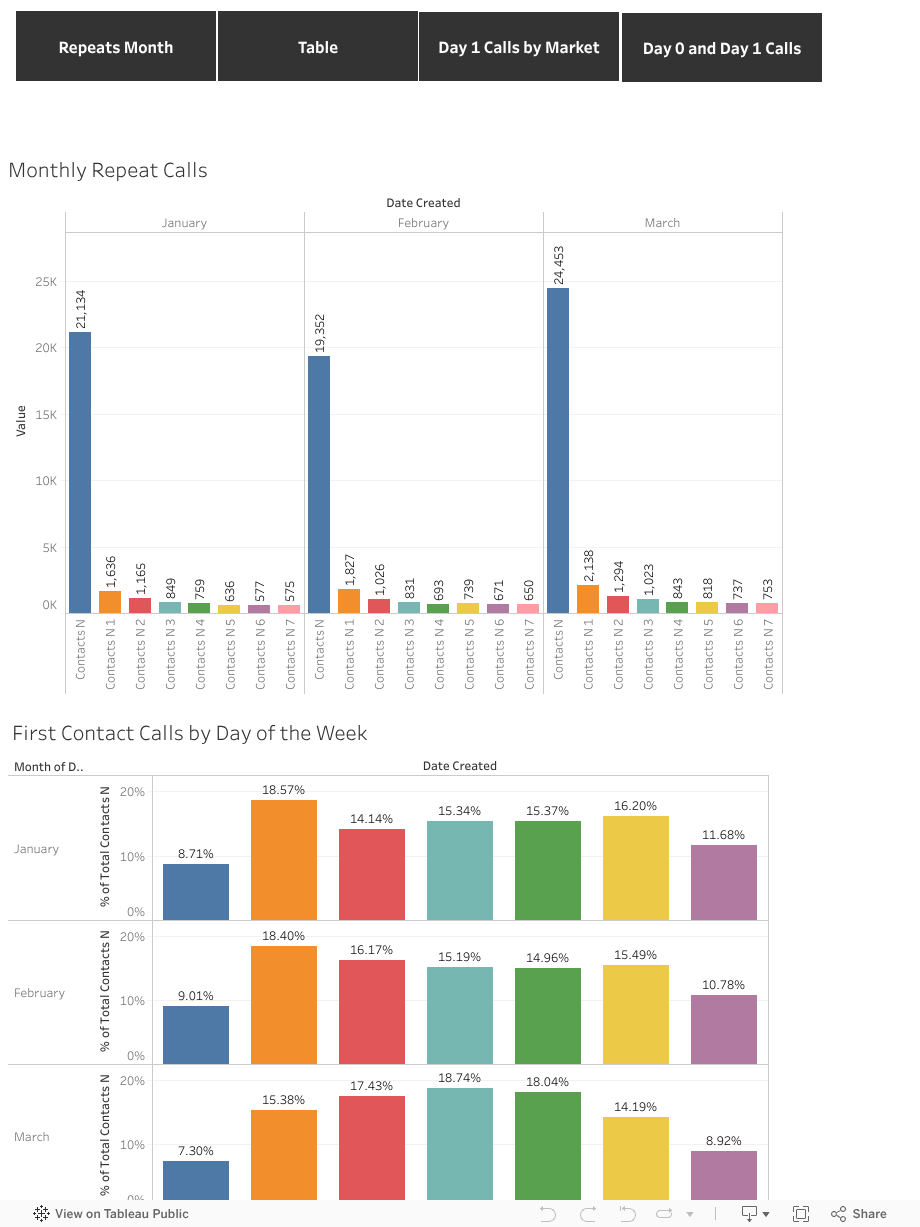
Project Summary — Google Fiber Repeat Caller Analytics Dashboard
I developed an end-to-end Business Intelligence solution for the Google Fiber Customer Service team to analyze and reduce repeat customer calls. Using fictionalized yet realistic call-center data, I built a complete data pipeline and dashboard that reveals how often customers contact support multiple times, which issues drive these repeat calls, and how call patterns vary across three market areas.
Data Engineering & ETL Pipeline (GCP + BigQuery)
I constructed a cloud-based ETL workflow using Google Cloud Platform (GCP) and BigQuery to ingest, clean, and model the call center datasets. This process included:
Importing raw CSV datasets into BigQuery
Cleaning and standardizing date and problem-type fields
Transforming call-sequence columns into repeat-call metrics
Creating analytical tables optimized for visualization and trend exploration
This pipeline ensured scalable, query-efficient access to all datasets for stakeholders.
BI Dashboard Development (Tableau)
-
I built an interactive Tableau dashboard aligned with stakeholder requirements, enabling users to explore:
-
Repeat calls by the first contact date
-
Problem types and markets driving repeat patterns
-
Trend views across week, month, quarter, and year
-
High-frequency issue categories and market-level comparisons
Minnesota Interstate Traffic Volume Analysis
Introduction
As Minnesota’s traffic volume continues to rise, effective management strategies are becoming increasingly important. This project leverages historical datasets to generate data-driven insights into traffic patterns. The analysis explores multiple dimensions, including monthly and hourly trends, as well as the impact of holidays and weather conditions. These findings provide valuable perspectives for transportation planning, policy-making, and infrastructure management.
Tableau Dashboard

Executive Report
Check out the detailed executive summary of this project here:
💻 Current and Emerging Technology Trends Among Developers: A Data Analysis of the 2019 Stack Overflow Survey
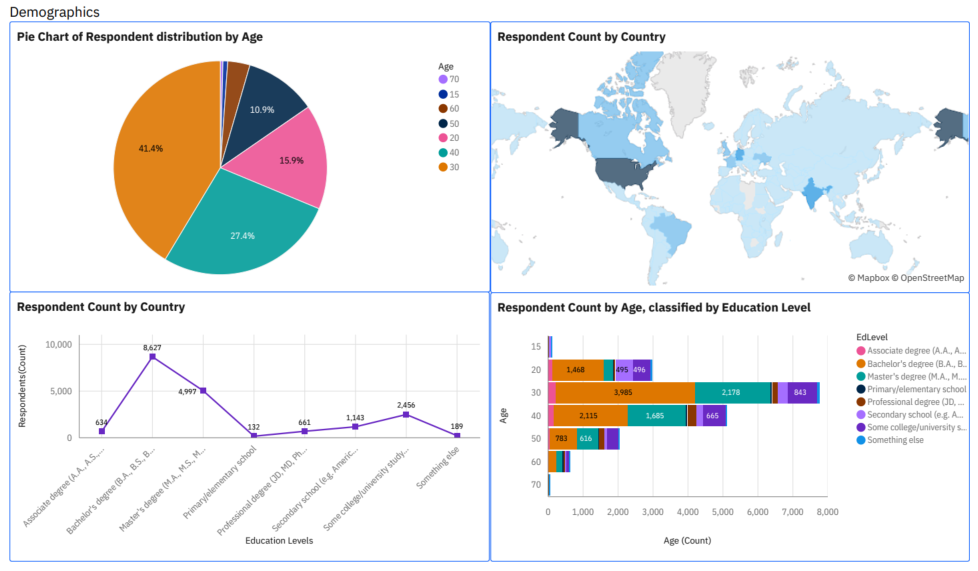
Introduction This project draws insights from Stack Overflow’s Developer Survey, one of the world’s largest surveys of its kind, with responses from nearly 90,000 developers worldwide. By analyzing both current and aspirational technologies used in the field, it uncovers key trends shaping the global developer landscape. The findings offer valuable demographic insights to inform hiring and training strategies, support data-driven technology investment decisions, and guide developer upskilling initiatives. This analysis highlights global patterns and forecasts the future directions of the tech industry.
Methodology
- 🗂️ Data Collection
Extracted data from the Stack Overflow Developer Survey
Retrieved job data using the GitHub Jobs API
Employed web scraping and Python requests API calls to gather additional datasets
- 🧹 Data Preparation
Cleaning: Removed duplicates, handled missing values, and normalized the data
Wrangling: Reshaped and merged multiple datasets to prepare for analysis
- 📈 Exploratory Data Analysis (EDA)
Analyzed distributions, detected outliers, and explored variable correlations
Tools used: Python (Pandas, Matplotlib, Seaborn)
- 📊 Data Visualization
Visualized key distributions, relationships, and comparisons
Built interactive dashboards to communicate trends and findings effectively
- 📊 Dashboard Development
Developed final dashboards using:
IBM Cognos Dashboard Embedded (CDE)
Google Looker Studio
Focused on storytelling and actionable insight delivery
Result
🔍 Insights from the Data
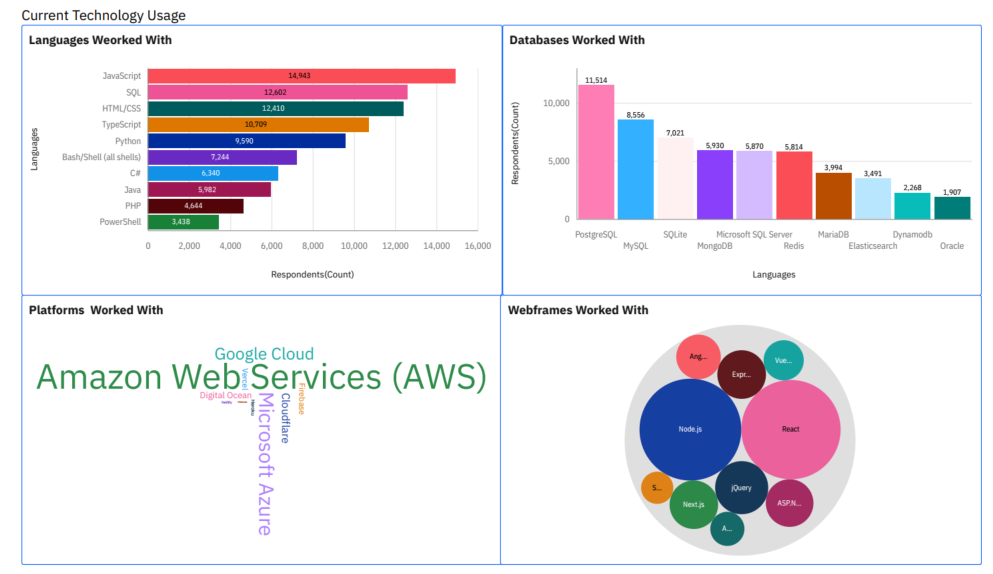
- 🌐 Web Technologies Dominate
Front-end technologies, such as JavaScript, TypeScript, HTML, and CSS, remain at the forefront of developer usage, reinforcing their central role in modern software development.
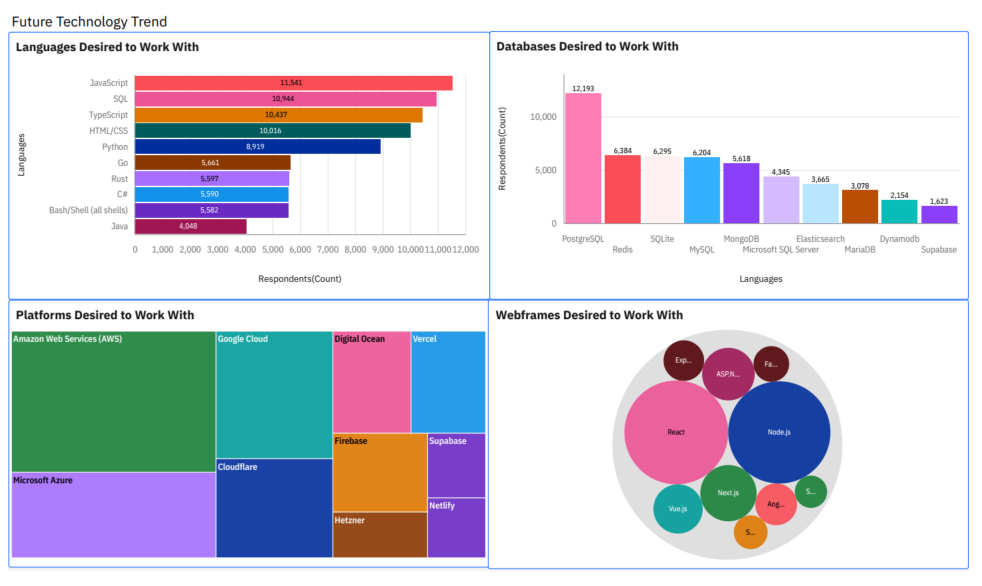
- 📈 Growth in Systems Languages
Languages such as Go and Rust are seeing increased adoption, signaling growing interest in performance-oriented, memory-safe programming paradigms.
- 🔄 SQL and Python Remain Consistent
As core languages for data manipulation and analysis, SQL and Python continue to demonstrate strong and steady relevance across multiple domains, including data science, backend development, and automation.
🧩 Key Takeaways & Recommendations
-
Investing in technology training is crucial—particularly in developing countries—to bridge skill gaps and drive innovation.
-
Continuous upskilling in web development languages ensures developers remain relevant in a fast-paced and ever-changing tech ecosystem.
-
Developers should prioritize mastering in-demand technologies like PostgreSQL, Redis, Go, and Rust to enhance their competitiveness in the job market.
-
The prevalence of open-source RDBMS underscores the importance of promoting and supporting open-source tools within developer communities to sustain collaboration and growth.
Read the full project report
🚗 CarMax Hackathon Using Python Visualization, Machine Learning Tools, and Streamlit
Problem Statement Many customers decide to trade in their current vehicle when purchasing a car at CarMax. What does a customer’s appraised vehicle tell us about the vehicle they will ultimately purchase? How can CarMax utilize this information to enhance business operations and deliver a more personalized shopping experience to its customers?
Solution I created an interactive app that visualizes CarMax’s data, highlighting the distribution of cars across various states, makes, and models. Additionally, I built a Random Forest classifier using encoded data to predict customers’ likelihood of switching car makes, helping CarMax optimize its offerings and customer experience, and created a dashboard using Google Looker Studio. The model performs well in identifying customers who switch car makes, but has lower precision for those who stay with the same make due to an imbalanced dataset. Future improvements could involve applying techniques such as oversampling, undersampling, or SMOTE to mitigate the effects of class imbalance and enhance model performance for customers who remain loyal to the same make. This insight could guide targeted marketing strategies.
🧠Machine Learning Models Applications
🔍 Automatic Model Hyperparameters GridSearch for Classification Models Using Python and Streamlit
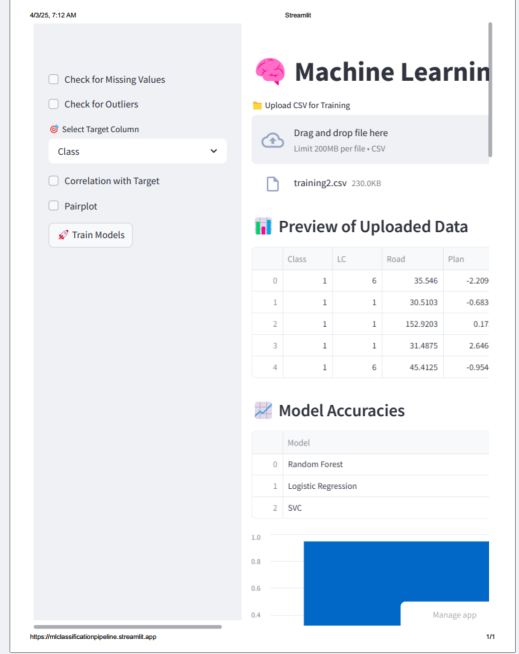
This project is a modular machine learning pipeline built using Python and Streamlit. Through an intuitive web interface, users can preprocess data, explore datasets, train machine learning models, and make predictions on unseen data. The pipeline supports a machine learning workflow, from data cleaning to model evaluation and prediction.
Features
- Preprocessing: Handle missing values and outliers with user-defined options.
- Exploratory Data Analysis: Analyze target correlation and generate pairplots for insights.
- Model Training: Train and tune multiple models (Random Forest, Logistic Regression, XGBoost, SVC) using GridSearchCV.
- Model Selection and Evaluation: Automatically pick the best model and evaluate its performance.
- Prediction: Predict outcomes for unseen data with a trained model.
- Visualization: View feature contributions using Random Forest feature importance.
Files and Structure preprocess.py: Functions for data preprocessing (missing values, outliers). explore.py: Functions for exploratory data analysis. train.py: Functions for training and tuning machine learning models. model.py: Functions for selecting the best model and evaluating feature importance. prediction.py: Functions for preprocessing and predicting outcomes on unseen data. classification_app.py: The main Streamlit app that integrates all modules. requirements.txt: List of dependencies for the project.
How to Run
- Install dependencies:
- Copy code
- pip install -r requirements.txt
- Start the Streamlit app:
- bash
- streamlit run classification_app.py
- Follow the steps in the app to upload data, preprocess, explore, train models, and make predictions.
Deployment This app can be deployed to Streamlit Cloud for easy sharing and accessibility.
Technologies Used
- Python
- Streamlit
- Scikit-learn
- XGBoost
- Seaborn
- Matplotlib
✅ Machine Learning Course Project: Detection of Anomalies in Credit Card Transactions Using Supervised and Unsupervised Learning Techniques
Abstract – In the financial sector, financial fraud is a rising problem with serious effects. The identification of credit card fraud in online transactions was greatly helped by big data analysis. Due to two main factors—first, the profiles of legitimate and fraudulent behavior change often, and second, credit card fraud data sets are extremely skewed—detection of credit card fraud, a data mining challenge, becomes difficult. The dataset sampling strategy, variable choice, and detection methods employed all have significant impacts on the effectiveness of fraud detection in credit card transactions. The performance of isolation forest (iForest), local outliers’ factor(LOF), and Logistic regression (LR) on highly skewed credit card fraud data are examined in this study. The model was constructed using real data from European cardholders, and under-sampling methods were also applied. The three models were implemented in Python, and the effectiveness of the methods is assessed based on accuracy, recall, precision, and the Kappa score coefficient. The outcomes indicate that Isolation Forest has the best accuracy at 99.8% in detecting outliers.
📊 Interactive Data Analysis App Using Python and Streamlit
This web-based app allows users to easily upload CSV files and perform exploratory data analysis and linear regression modeling. Built with Streamlit, the app features:
📁 CSV file upload and preview
📈 Summary statistics and correlation heatmaps
📌 Interactive scatter plots with trendlines (via Plotly)
📊 Histograms for data distribution
📉 Linear regression modeling with RMSE and coefficient outputs
📈 Visualization of actual vs. predicted values
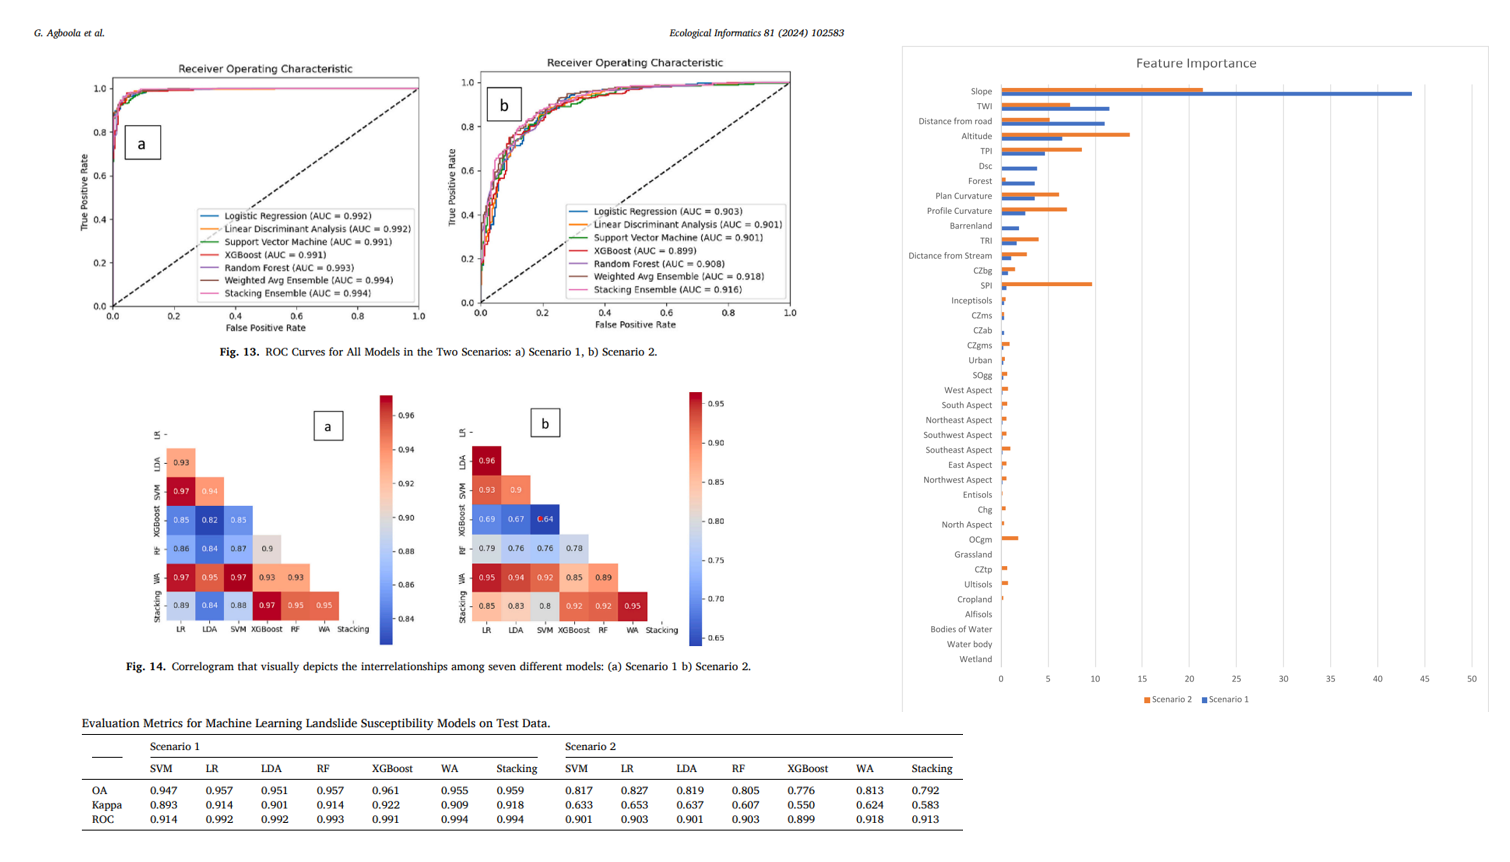
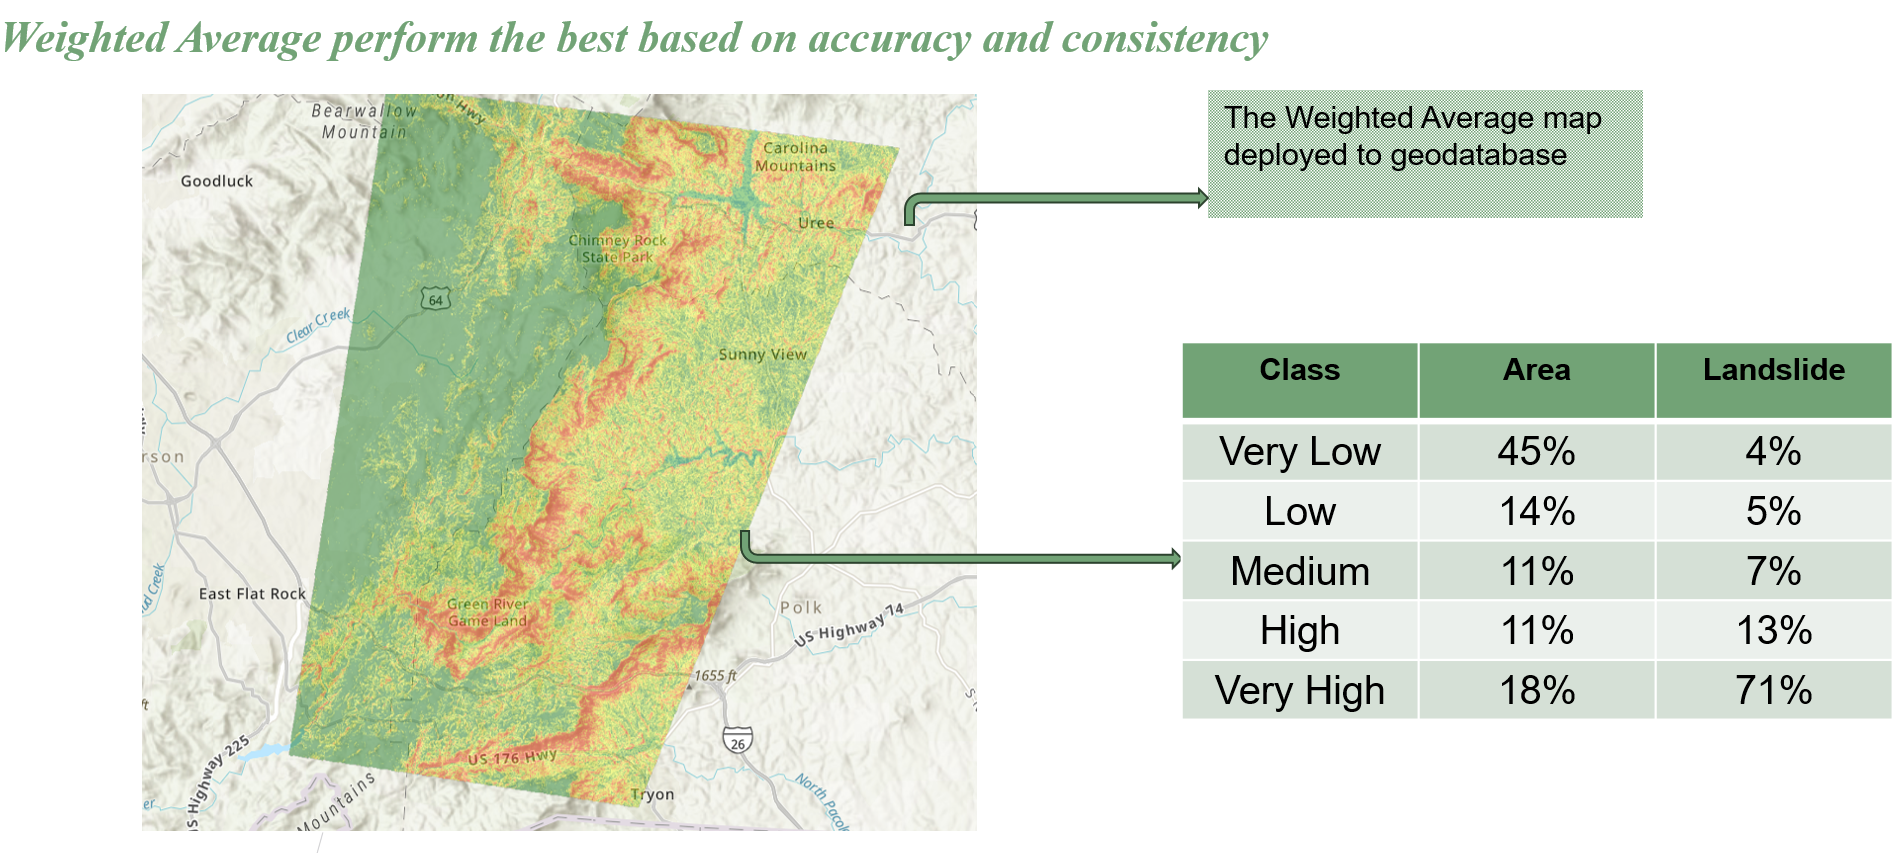
🚀 Optimizing Landslide Susceptibility Models through Ensemble Classification Techniques
This study aims to assess how well machine learning models perform on landslide susceptibility mapping. For Polk County, Western North Carolina, seven distinct models were examined for landslide susceptibility modeling: Support Vector Machine (SVM), Logistic Regression (LR), Linear Discriminant Analysis (LDA), Random Forest (RF), Extreme Gradient Boosting (XGBoost), and ensemble techniques (Stacking and Weighted Average). A dataset of 1215 historical landslide events and 1215 non-landslide sites, as well as fourteen geographic data layers, is used to evaluate these models. Metrics including accuracy, F1-score, Kappa score, and AUC-ROC are used to assess these models’ performance, with a focus on how non-landslide random sampling affects model outcomes.
The buffer-based scenario’s AUC-ROC was 91.8%, and the slope threshold scenario’s was 99.4%. The weighted average ensemble of the five models yielded the best results. This demonstrates the effectiveness of machine learning in landslide susceptibility mapping, offering a strong instrument for pinpointing high-risk regions and guiding plans for disaster risk reduction.
For more details, refer to the full paper:
 Optimizing landslide susceptibility mapping using machine learning and geospatial techniques
👁️🗨️ Computer Vision Methods
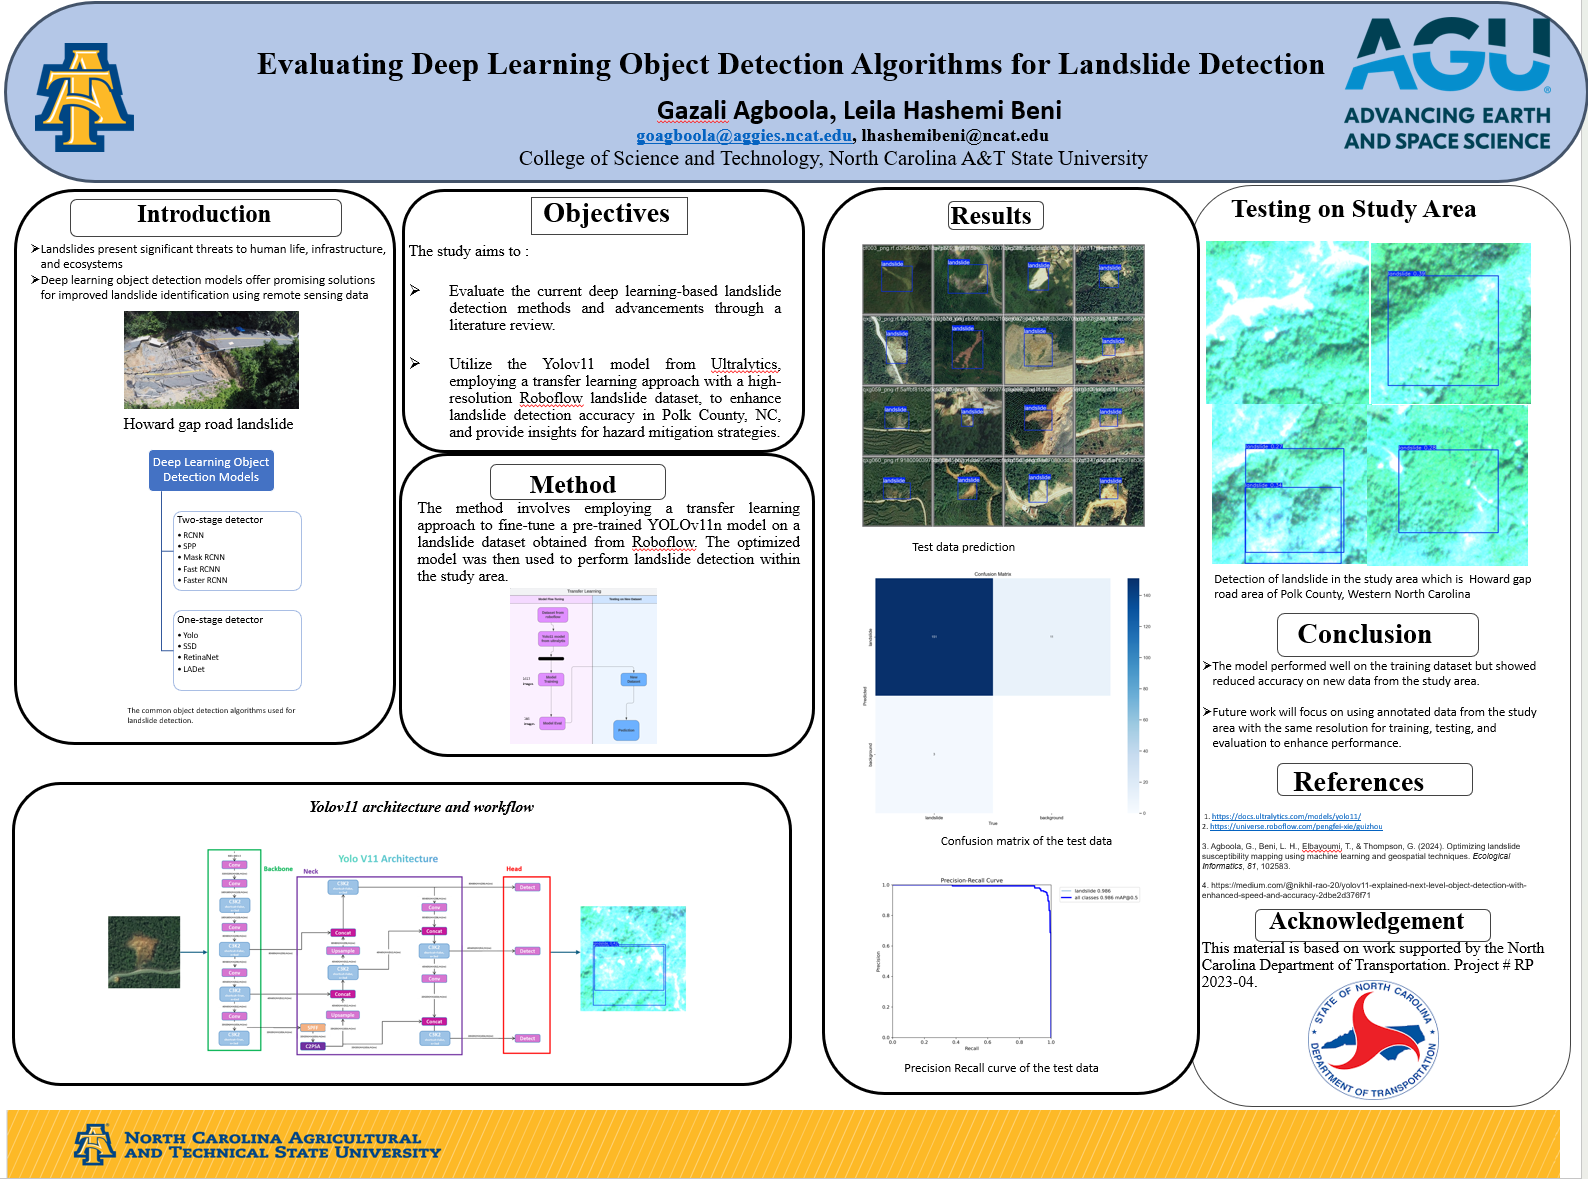
👁️🗨️ Automatic Landslide Detection using a Fine-Tuned YOLOv11 Model
I employed the YOLOv11 model from Ultralytics, utilizing a transfer learning approach with a high-resolution Roboflow landslide dataset, to improve landslide detection accuracy in Polk County, NC, and to provide valuable insights for developing effective hazard mitigation strategies.
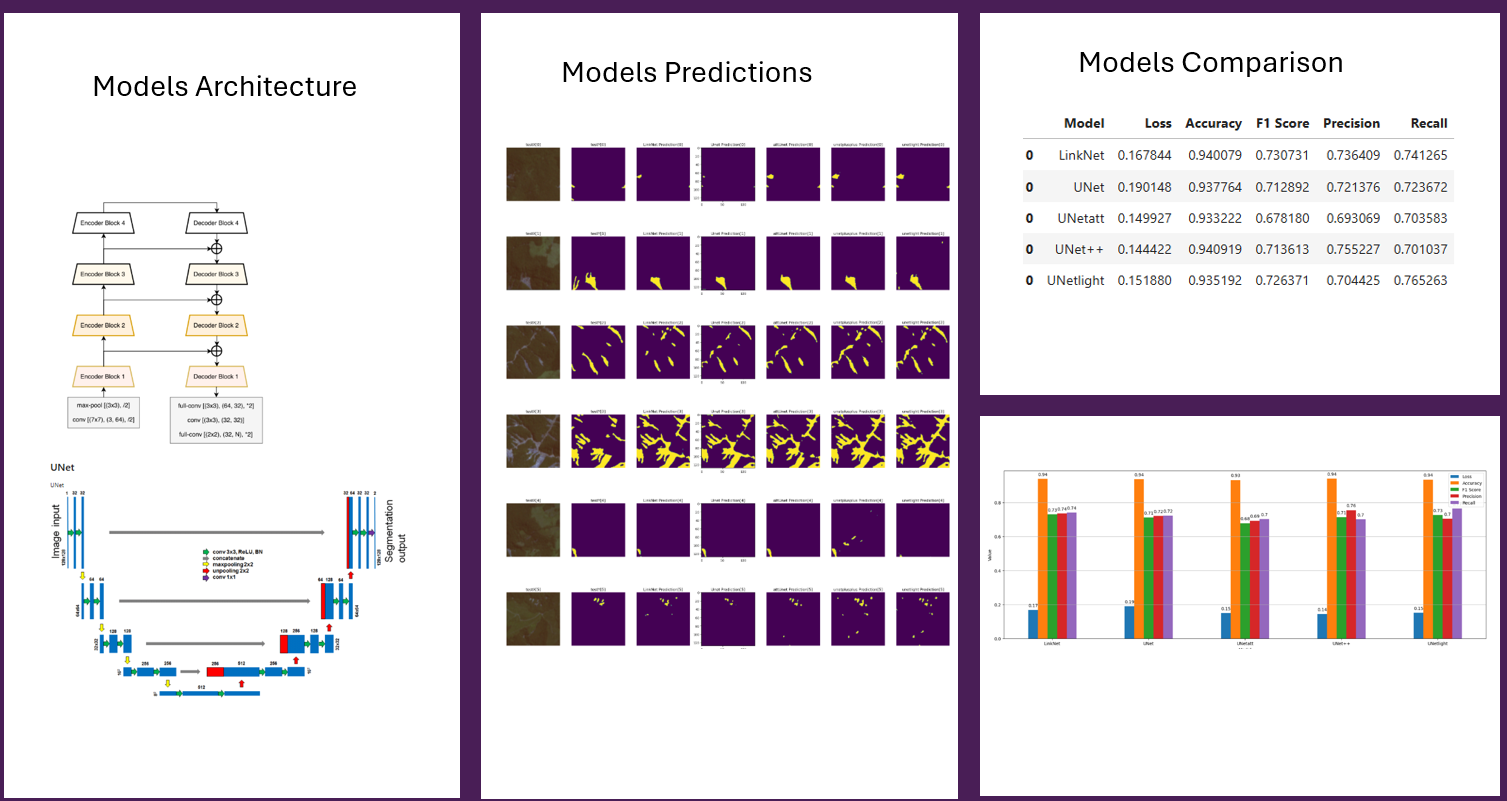
⚠️ Landslide Identification using Segmentation Models
The objective of this project is to investigate the potential of deep learning algorithms for analyzing remote sensing data for landslide detection, using an open-source dataset from Meena et al. 2023.
🤖 Generative AI Applications and Building Chatbots with Pre-trained LLM Models
View the code
🏔️ Landslide Assessment Agent(An AI-driven interactive disasters monitoring app)
💡 Creating EDU-Navigator for HBCU students(HP Future of Work Academy (FOWA) Challenge)
I worked as a software developer on a team named “20,” consisting of 5 members, to develop the EDU-Navigator chatbot for HBCU students. The chatbot, powered by the Chat-GPT turbo engine, was designed to help students navigate their educational journey. Our team received an honorable mention in the HP Future of Work Academy (FOWA) Challenge.
📚 Google 5-Day Generative AI Intensive Training
I participated in the Google 5-Day Generative AI intensive training, which included a hands-on assignment each day on Kaggle.
Day 1 - Prompting
I worked through example prompts and techniques using the Python SDK and AI Studio, with further insights provided in the Prompting whitepaper. I also explored various apps built with the Gemini family of models for inspiration. Notebook
Day 1 - Evaluation and Structured Output
I focused on evaluating the performance of LLMs in real-world tasks, specifically learning how to assess and measure their outputs effectively. Notebook
Day 2 - Classifying Embeddings with Keras
I learned how to classify embeddings using Keras and the Gemini API, enhancing my understanding of model classification. Notebook
Day 2 - Embeddings and Similarity Scores
I explored embeddings and similarity scores with the Gemini API, using its embedding endpoint to analyze similarity scores between different data points. Notebook
Day 2 - Document Q&A with RAG
I learned how to implement Retrieval Augmented Generation (RAG) with Chroma to enhance Document Q&A. I created a vector database with the Gemini API to retrieve relevant information and generate tailored answers, overcoming LLM limitations by processing external, unseen data and using Chroma for efficient document searching and embedding. Notebook
Day 3 - Function Calling with the Gemini API
I explored function calling with the Gemini API, learning to build a chat interface over a local database using the API’s automatic function-calling feature. Though the example was a simple project without real-world safety constraints, it demonstrated how to integrate AI chat capabilities into existing applications. Notebook
Day 4 - Fine-Tuning a Custom Model
I delved into fine-tuning a custom model using the Gemini API, focusing on training the model to classify newsgroup posts into their respective categories. The fine-tuning process enabled me to tailor the model for specific tasks like entity extraction, summarization, and creative generation. I also discovered that AI Studio supports creating and monitoring tuned models via a web UI using data from Google Sheets, Drive, or my own files. Notebook